Diagnostics
Debugging information is needed to solve complex setup or troubleshooting issues. This information is primarily intended for developers and technical support engineers.
On the Diagnostics page of the web interface, you can check the network connections, view and save the router system log, configure network traffic capture, enable the debug mode, and view a list of active connections with the ports used.
Self-test file
Refer to the Saving the self-test file instructions for more information.
To save the
self-testfile from the Diagnostics page in the Self-Diagnostics section, click on Download the self-test file.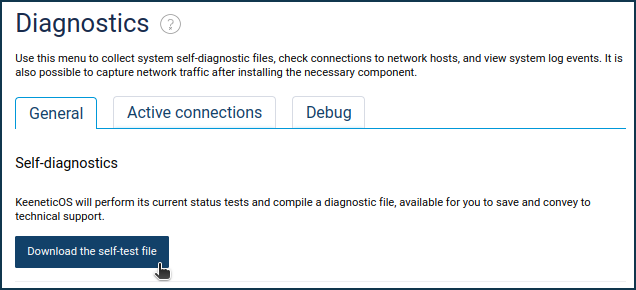
The web browser will download the file. If the Save File window appears, specify the location (the folder in which the file will be saved) and press Save or OK.
You can open the
self-test.txtsystem file for viewing in any text editor.System log
Please refer to the System log manual for more information.
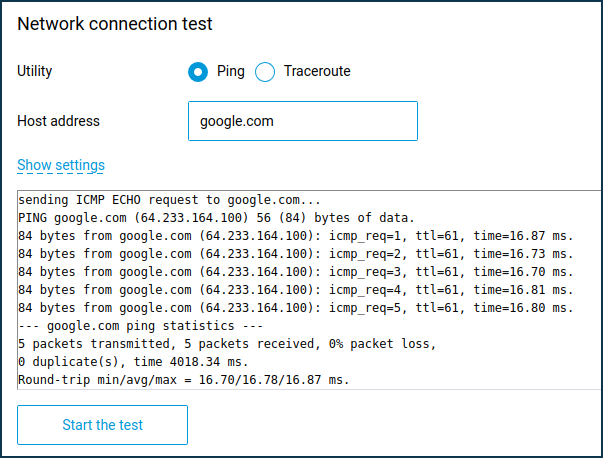
Network connection test
In the Network connection test section, you can test the connection to the Internet directly from your Keenetic using the ping and traceroute network utilities. In the Host address field, specify the host's IP address or domain name you want to test and click the Start the test button. Click Show settings to configure more settings.
Packet capture
In the Packet Capture section, you can enable capturing network traffic passing through the selected interface of your Keenetic. You may find more information in the article Network packet capture.
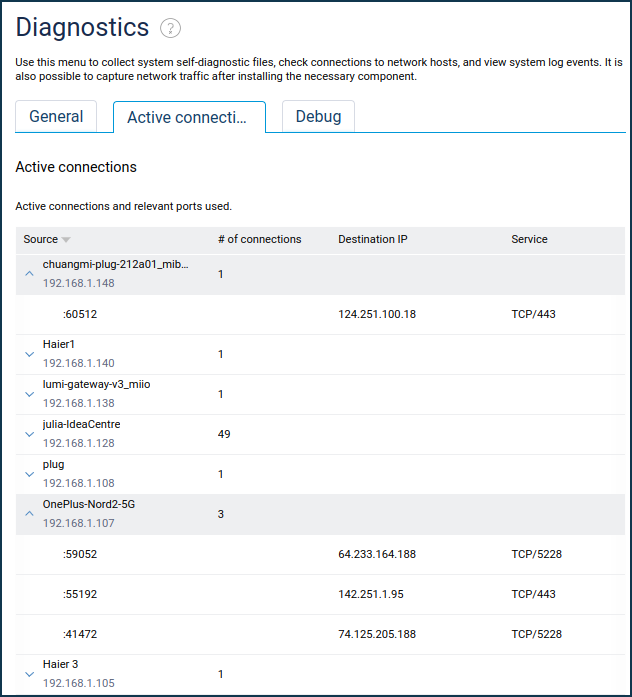
Active connections
A separate Active Connections tab displays a list of active connections with the ports used. For example: